Brake lights ripple backward on I-5 near Sacramento a little after five on a Thursday. One driver slides over a lane line without a mirror check. Another is running well above the flow of traffic. A third looks down at a phone for what feels like no time at all. A few seconds later, four or five vehicles are tangled together, injuries range from a stiff neck to something far more serious, and somewhere in an office park a group of claims adjusters is already sharpening pencils over percentages.
In a good number of states, a plaintiff who carries even a sliver of blame walks away with nothing. California abandoned that approach in 1975 and has not looked back. Under pure comparative fault, an injured person’s recovery gets trimmed by their own share of responsibility and nothing more. Fifteen percent at fault, fifteen percent reduction. Sixty percent at fault, sixty percent reduction. The claim survives either way.
Pure Comparative Fault Is Still the Governing Standard
The mechanics are straightforward on paper. Whoever decides the case, judge or jury, assigns each party a numerical share of fault, and those shares have to add up to exactly 100 percent. Sometimes non-parties get folded into that allocation too, which surprises people. Damages then shrink by the plaintiff’s percentage. That is the whole arithmetic.
Civil Code section 1714 is the provision most often cited as the statutory anchor here, since it addresses both the general duty to use ordinary care and the effect of an injured person’s own lack of it. Courts have been building on that language for half a century.
Where things get messy is proof. Untangling liability in a five-car pileup usually means accident reconstruction, competing expert opinions, and insurers who have every incentive to inflate the injured party’s percentage by ten or twenty points. That is not a fair fight for someone handling it alone from a hospital bed, which is why working with a knowledgeable injury law firm in Sacramento tends to matter more in shared-fault cases than in clean rear-end collisions. The percentage assigned is not a fact of nature. It is an argument, and arguments get won or lost on evidence.
Multi-Vehicle Crashes Force a Harder Look at Who Did What
Traffic Safety Quick Stats, the running data summary maintained by the California Office of Traffic Safety, put statewide traffic deaths at 4,061 in 2023, down from 4,539 the year before. That is close to an 11 percent improvement, which is genuinely good news and still a sobering absolute number. The same summary lists a Mileage Death Rate of 1.26 fatalities for every 100 million vehicle miles traveled.
Break the total apart and the shared-fault picture sharpens. The 2025 Alcohol-Impaired Driving fact sheet from UC Berkeley’s Safe Transportation Research and Education Center counted 1,355 alcohol-impaired fatalities in California for 2023, roughly a third of everything. Office of Traffic Safety figures for the same year show 1,106 pedestrian deaths and 583 motorcyclist deaths.
Those categories rarely involve one clean act of negligence. Speeding shows up alongside an unsafe lane change. A failure to yield gets compounded by a following distance nobody would defend in a deposition. The Transportation Injury Mapping System, which geocodes records from the Statewide Integrated Traffic Records System, keeps surfacing the same clusters of overlapping contributory factors along state highways. Two or three drivers each did something wrong. Now somebody has to put numbers on it.
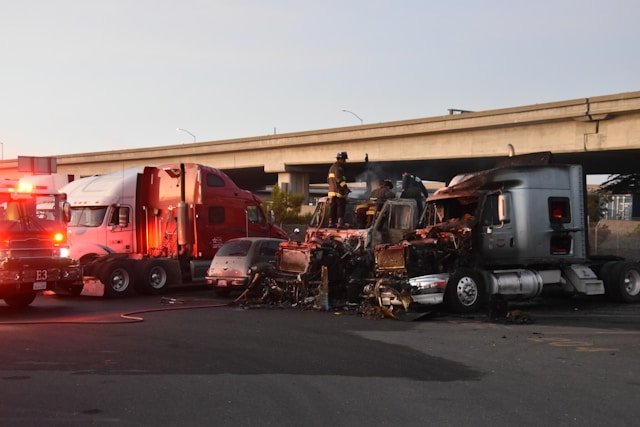
Image Source: Unsplash
The 1975 Decision That Rewrote the Rules
None of this was available to injured Californians before Li v. Yellow Cab Co. of California. Until that case, contributory negligence operated as a complete bar. A plaintiff who was one percent careless collected zero. Harsh, and everyone knew it was harsh, including the judges applying it.
The California Supreme Court refused to accept that result, discarded the contributory negligence bar, and adopted pure comparative fault instead. Liability, the court held, ought to follow each party’s actual contribution to the harm. Every modern shared-blame evaluation in this state traces back to that opinion.
What is striking is how contemporary the underlying crash still feels. A left turn across multiple lanes, imperfect light, a driver moving too fast to react. Swap the taxi for a delivery van and it could have happened on Folsom Boulevard last Tuesday.
How Jury Instructions Turn Blame Into Percentages
At trial, the sequence is deliberate. Jurors first calculate total damages without thinking about fault at all. Then they apportion responsibility. Only afterward does the court apply the reduction.
Two of the Judicial Council’s Civil Jury Instructions do the heavy lifting. CACI No. 405 covers comparative fault of the plaintiff. CACI No. 406 handles apportionment among everyone at fault, including parties who never showed up in the lawsuit. Proposition 51, codified at Civil Code section 1431.2, then limits joint and several liability for non-economic damages, so each defendant’s exposure for pain and suffering tracks its own percentage rather than the group’s.
So what does a 40 percent finding actually mean for medical bills and lost wages? Sixty cents on the dollar. A plaintiff found 70 percent responsible still collects the remaining 30 percent. There is no 50 percent trapdoor, no 51 percent cutoff, nothing like the modified systems most other states use. Whether that strikes you as generous or merely logical probably depends on which side of the caption you sit on.
Primary collision factors recorded in Annual Crash Data on California State Highways, published by Caltrans, plus California Highway Patrol reports, supply much of the raw material. Unsafe speed, improper turning, following too closely. Add electronic control module downloads, dashcam footage, and witness statements, and the percentages start to firm up.
When Speed and Impairment Land in the Same Crash
Speeding travels in company. The Traffic Safety Facts research note titled Overview of Motor Vehicle Traffic Crashes in 2024, issued by the National Center for Statistics and Analysis at NHTSA, keeps speeding in the neighborhood of a quarter of fatal crashes nationally, and California corridors track that pattern closely enough.
Put an impaired driver and a badly speeding driver in the same intersection and both percentages go into the calculation. Those 1,355 alcohol-impaired deaths from 2023 illustrate the tension well. Even where the impaired driver plainly carries the larger share, a sober driver who also broke a rule of the road absorbs a reduction. Pure comparative fault does not reward moral outrage. It allocates.
Commercial vehicles complicate matters further, since claims may involve a driver, a motor carrier, a maintenance contractor, and a broker, each with separate counsel and separate theories. Roadway design, signage, and maintenance obligations sometimes enter the picture as well, which changes the deadline analysis considerably.
The Clock Runs No Matter How the Percentages Look
Most highway injury claims must be filed within two years of the date of injury under Code of Civil Procedure section 335.1. Comparative fault has no effect on that deadline whatsoever.
Practically speaking, the evidence that determines percentages disappears well before the statute does. Event data recorders get overwritten. Vehicles go to salvage and then to auction. Carrier phone records fall outside standard retention windows. Skid marks survive one rainstorm, maybe. Waiting eighteen months to investigate a five-vehicle crash is a decision, and usually not a good one.
Public entities operate on a much tighter schedule. When a state highway design defect or a government-owned vehicle contributes, the six-month government claim requirement under the Government Claims Act frequently becomes the controlling deadline. Blow past it and the claim is gone, however favorable the fault allocation would have been.
Readers dealing with a driver who fled the scene, or with liability that both carriers are actively disputing, may find additional context in this guide on hit-and-run lawyer costs in California.
Factors Juries Commonly Weigh in Highway Cases
- Relative speeds of each vehicle at the moment of impact
- Compliance with traffic control devices and lane markings
- Impairment by alcohol, prescription medication, or drugs
- Distraction evidence, phone records included
- Visibility, weather, and pavement conditions
- Conduct of non-party drivers who set the chain reaction in motion
Those items almost never stand alone, and no single one decides a case. The fact-finder has to weigh them against each other and express the result as percentages summing to 100.
Looking ahead, the Strategic Highway Safety Plan for 2025 through 2029 continues to build on the Safe System Approach and sets fresh reduction targets for fatalities and serious injuries. Between the Caltrans crash datasets and the mapping tools out of SafeTREC, there is now a reasonably clear empirical picture of where shared-fault collisions concentrate.
Protecting a Claim Under These Rules
California’s framework remains one of the more accessible in the country for injured people. It came out of a 1975 decision that rejected all-or-nothing outcomes, and it governs every multi-vehicle highway collision in the state today. Recent Office of Traffic Safety and SafeTREC figures show fatalities declining while alcohol and speed keep turning up as contributing factors, often in the same crash. Jury instructions convert that mess into precise numbers. The two-year statute keeps running through all of it.
This article offers general information about California law and publicly reported traffic statistics. It is not legal advice. Every collision turns on its own facts, and outcomes depend on the specific evidence and the legal analysis applied to it. Anyone considering a claim should speak with qualified counsel about their particular situation.